Section 1. The week ahead
Projected — every number below is model outputThe Best Picks, By Position
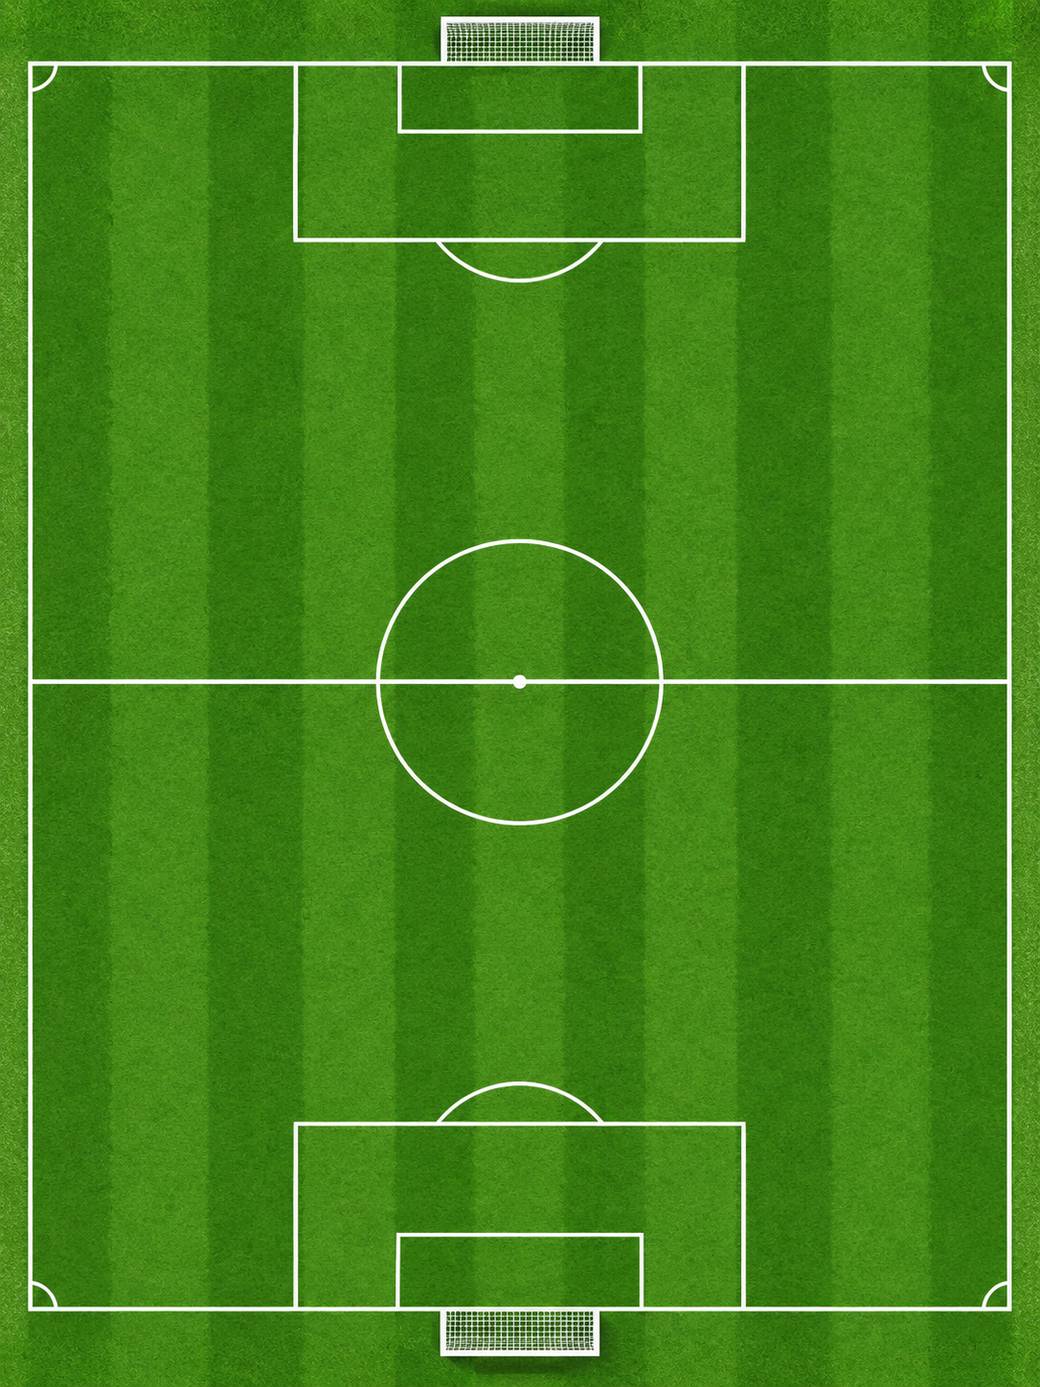
A projection, not a prediction of what will happen.
Gameweek 8 picks: the top five at each position
| Player | Club | Position | Projected pts | Price |
|---|---|---|---|---|
| David Raya | Arsenal | Goalkeeper | 5.6 | £6.1m |
| James Trafford | Leeds United | Goalkeeper | 4.3 | £5.0m |
| Konstantinos Tzolakis | Hull City | Goalkeeper | 4.0 | £4.7m |
| Bernd Leno | Fulham | Goalkeeper | 4.0 | £4.5m |
| Gianluigi Donnarumma | Manchester City | Goalkeeper | 3.9 | £5.5m |
| Riccardo Calafiori | Arsenal | Defender | 6.0 | £6.0m |
| Jayden Bogle | Leeds United | Defender | 5.8 | £4.7m |
| Gabriel | Arsenal | Defender | 5.4 | £7.9m |
| De Cuyper | Brighton & Hove Albion | Defender | 5.1 | £5.3m |
| Lewis Hall | Newcastle United | Defender | 5.1 | £5.3m |
| Bryan Mbeumo | Manchester United | Midfielder | 6.3 | £7.8m |
| Rayan Cherki | Manchester City | Midfielder | 5.7 | £8.0m |
| Morgan Rogers | Chelsea | Midfielder | 5.7 | £8.0m |
| Pascal Groß | Brighton & Hove Albion | Midfielder | 5.5 | £6.2m |
| Morgan Gibbs-White | Nottingham Forest | Midfielder | 5.5 | £7.9m |
| Erling Haaland | Manchester City | Forward | 7.8 | £15.7m |
| Dominic Calvert-Lewin | Leeds United | Forward | 5.4 | £6.1m |
| João Pedro | Chelsea | Forward | 5.1 | £7.9m |
| Alexander Isak | Liverpool | Forward | 4.8 | £9.0m |
| Gonzalo | Fulham | Forward | 4.4 | £6.1m |
The same picks as the pitch above, in order.
Method
- Built from each player's own last 10 gameweeks and the opponent's measured record.
- Modelled, not measured: the chance of a clean sheet — a Poisson on expected goals conceded.
- Bonus points: measured, not modelled. The player's own bonus per 90 minutes over his recent matches, carried forward as it stands, because FPL publishes no bonus model.
- Modelled, not measured: the crowd's ownership at the deadline, counted as four matches' worth of evidence and fading as real matches accumulate — it steadies August, when a player has one or two matches of history.
- Measured, not modelled: the transfer flow. A player who lost a large share of his owners in the week before the deadline is marked down by the share of such players who went on to play, measured over ten seasons — managers sell before news is official. Section 2 says what it was worth.
- Everything else is arithmetic on FPL's own published scoring table.
The Best Team £100m Could Buy
Solved exactly, under every rule the game actually imposes: £100.0m, fifteen players, 2 goalkeepers / 5 defenders / 5 midfielders / 3 forwards, no more than three from one club, a legal formation.
Each fallback assumes that player alone is unavailable — the fifteen are not a set you can take together.
Method
- The fallback is the best alternative at the same position for the same money or less.
- It is checked against the max-three-from-one-club rule, so the swap always leaves a legal squad.
- The same name can appear on more than one card, for the same reason.
- Injury and availability flags come from FPL's own published status.
- The bench scores nothing, so it holds the cheapest legal players — what the budget forces on a real manager.
- Prices are FPL's, at the last data refresh.
Section 2. Past weeks
Settled — published numbers onlyHow Our Formula Actually Did
2025-26, gameweeks 2–38 · 2026-27 so farThe same formula that produced Section 1, run over last season, using only what was known before each deadline — the rates, and the crowd's ownership as it stood that week. Scored against what really happened, and against FPL's own average manager score for each gameweek. Past the divider, this season so far, replayed the same way as each gameweek completes. The chart and the grid below show both figures: the full-strength number in the headline, and the formula stripped of chips and injury flags — which is what the bars plot.
The Season, Week By Week
Actual FPL points, gameweek by gameweek. Nothing here is projected.
The Best XI Of Gameweek 7
Not a recommendation — a fact: the best XI £100.0m could actually have bought that week.
Solved exactly on actual points and the actual price of every player that gameweek.
Points Against Price
Season to date. Points and prices as FPL publishes them.
Defensive Contribution
The newest rule in the game, and the least visualised. Below is how often each player has actually cleared its threshold.
How the rule works
- Defenders: 2 points for 10 or more clearances, blocks, interceptions and tackles in a match.
- Midfielders and forwards: 2 points for 12 or more of those, plus ball recoveries.
- Goalkeepers do not receive it. It is capped at 2 points a match.
A counted rate over matches played, not a projection.
How The Game Scores
FPL's own table, read from the game's configuration rather than transcribed.
Method
- Our reimplementation of it reproduces 29,757 of 29,757 real player-gameweeks from last season exactly.
- That is what licenses everything in Section 1 — if the scoring layer were approximate, nothing downstream would be checkable.